top of page
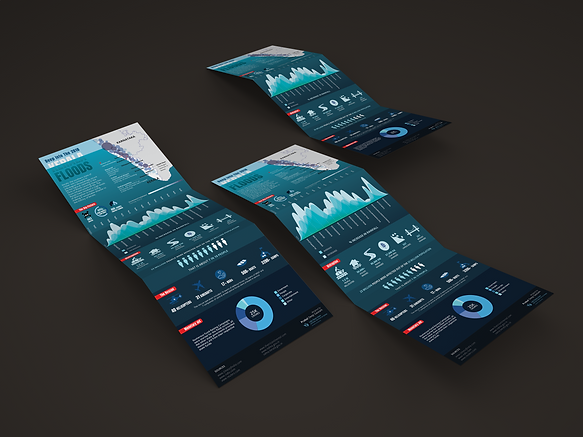
Kerala Flood 2018:
InfoGraphics
Duration: 1 week
Guide : Dr. Tridha Gajjar
Objective
-
Convert complex data into simplified visual form for easy analysis and understanding.
-
Data selection should be such, which allows exploring comparative analysis.
-
Use graphical devices like colour, form and type to convert information into a simplified visual representation.
Design Layout

bottom of page